Homework 6 – Creating Fake Data Sets To Explore Hypotheses
Grace (Rei) Jia
2025-02-19
My dataset was made at random for this homework assignment, very loosely based on biodiversity of alpine plant populations in the northeast.
Making data and a quick summary of each plant population:
plantpopulation1 <- rnorm(n=10, mean = 150, sd = 20)
plantpopulation2 <- rnorm(n=10, mean = 200, sd = 50)
summary(plantpopulation1)
## Min. 1st Qu. Median Mean 3rd Qu. Max.
## 113.1 130.7 141.0 143.7 155.8 183.3summary(plantpopulation2)## Min. 1st Qu. Median Mean 3rd Qu. Max.
## 87.19 168.30 191.17 205.43 218.08 332.87Putting it into a data frame:
Plant_Populations <- c(plantpopulation1, plantpopulation2)
Group_Name <- c(rep("Plant_Population_1", length(plantpopulation1)),rep("Plant_Population_2",length(plantpopulation2)))
plant_df <- data.frame(Plant_Populations, Group_Name)
print(plant_df)
## Plant_Populations Group_Name
## 1 128.38969 Plant_Population_1
## 2 123.06429 Plant_Population_1
## 3 138.19452 Plant_Population_1
## 4 147.42358 Plant_Population_1
## 5 137.66437 Plant_Population_1
## 6 163.02152 Plant_Population_1
## 7 158.56765 Plant_Population_1
## 8 143.78702 Plant_Population_1
## 9 113.11185 Plant_Population_1
## 10 183.33917 Plant_Population_1
## 11 332.86879 Plant_Population_2
## 12 137.52791 Plant_Population_2
## 13 331.25964 Plant_Population_2
## 14 162.70305 Plant_Population_2
## 15 191.80040 Plant_Population_2
## 16 190.54359 Plant_Population_2
## 17 216.78565 Plant_Population_2
## 18 218.50721 Plant_Population_2
## 19 185.09608 Plant_Population_2
## 20 87.18923 Plant_Population_2Plotting the data
boxplot(Plant_Populations~Group_Name,data=plant_df, main="Alpine Plant Population Density",
        xlab="Plant Groups", ylab="Population Size")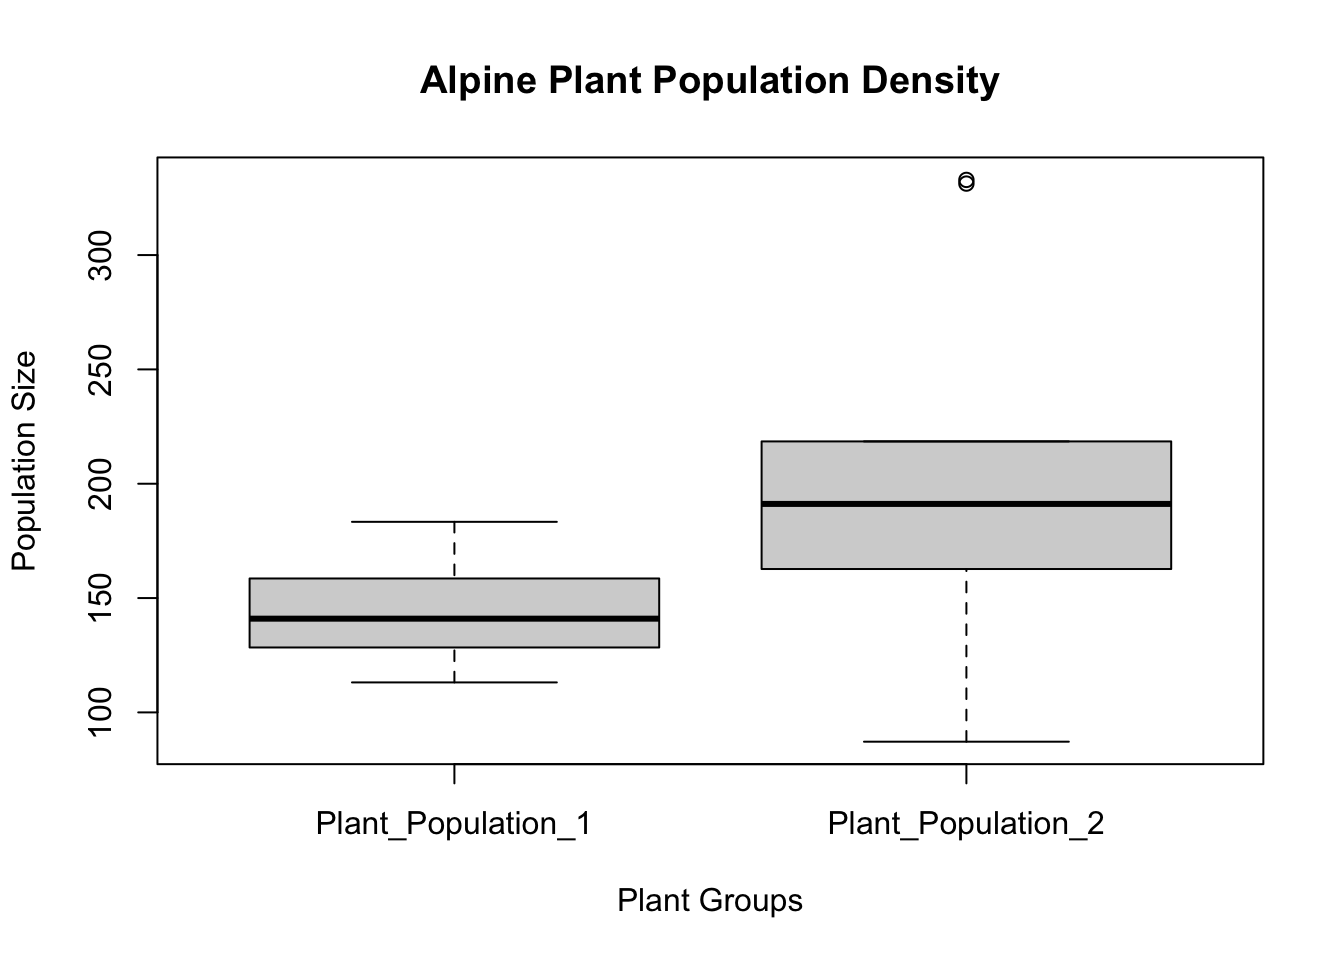
hist(plant_df$Plant_Populations,
     main = paste("Histogram of Plant Populations 1 and 2"),
     xlab = "Population Density", ylab = "Frequency")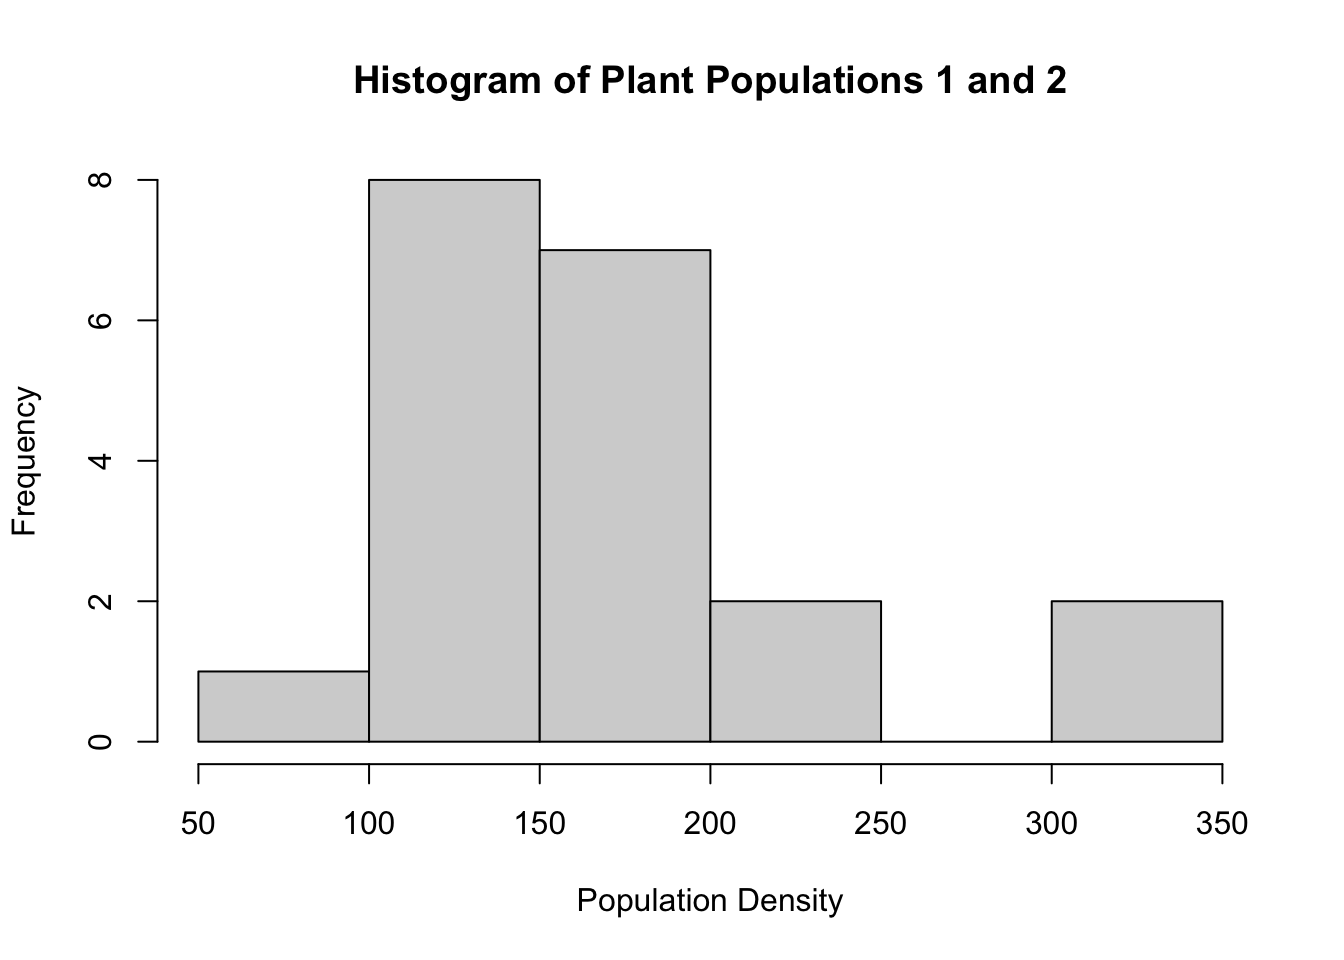
Using the same parameters as in the previous step, I am now using a for loop to simulate 20 different iterations of this combined plant populations. My original sample size was 10.
n_iterations <- 1:20

for (i in n_iterations){
  plantpopulation1 <- rnorm(n=10, mean = 150, sd = 20)
  plantpopulation2 <- rnorm(n=10, mean = 200, sd = 50)
  Plant_Populations <- c(plantpopulation1, plantpopulation2)
  Group_Name <- c(rep("Plant_Population_1", length(plantpopulation1)),rep("Plant_Population_2",length(plantpopulation2)))
  plant_df <- data.frame(Plant_Populations, Group_Name)
  test_result <- t.test(Plant_Populations~Group_Name, data = plant_df)
  n_iterations[i] <- test_result$p.value
  cat("Iteration=",i,"P-value=")
print(test_result$p.value)
}
## Iteration= 1 P-value=[1] 0.04919637
## Iteration= 2 P-value=[1] 0.01421303
## Iteration= 3 P-value=[1] 0.001186843
## Iteration= 4 P-value=[1] 0.05860265
## Iteration= 5 P-value=[1] 0.08726421
## Iteration= 6 P-value=[1] 0.05996385
## Iteration= 7 P-value=[1] 0.05196255
## Iteration= 8 P-value=[1] 0.03316013
## Iteration= 9 P-value=[1] 0.0108628
## Iteration= 10 P-value=[1] 0.635316
## Iteration= 11 P-value=[1] 0.1391313
## Iteration= 12 P-value=[1] 0.09997008
## Iteration= 13 P-value=[1] 0.006907205
## Iteration= 14 P-value=[1] 0.3943154
## Iteration= 15 P-value=[1] 0.05155986
## Iteration= 16 P-value=[1] 0.05742513
## Iteration= 17 P-value=[1] 0.007601885
## Iteration= 18 P-value=[1] 0.006036911
## Iteration= 19 P-value=[1] 0.07497359
## Iteration= 20 P-value=[1] 0.01146536From the 20 iterations above, I determined that several have a p-value of < 0.05 (which changes every time I run the for loop).
which(n_iterations < 0.05)## [1] 1 2 3 8 9 13 17 18 20Here I am running the same for loop but I changed the sample size to 5.
n_iterations <- 1:20

for (i in n_iterations){
  plantpopulation1 <- rnorm(n=5, mean = 150, sd = 20)
  plantpopulation2 <- rnorm(n=5, mean = 200, sd = 50)
  Plant_Populations <- c(plantpopulation1, plantpopulation2)
  Group_Name <- c(rep("Plant_Population_1", length(plantpopulation1)),rep("Plant_Population_2",length(plantpopulation2)))
  plant_df <- data.frame(Plant_Populations, Group_Name)
  test_result <- t.test(Plant_Populations~Group_Name, data = plant_df)
  n_iterations[i] <- test_result$p.value
  cat("Iteration=",i,"P-value=")
print(test_result$p.value)
}
## Iteration= 1 P-value=[1] 0.05189934
## Iteration= 2 P-value=[1] 0.04041652
## Iteration= 3 P-value=[1] 0.6619904
## Iteration= 4 P-value=[1] 0.02290493
## Iteration= 5 P-value=[1] 0.1352419
## Iteration= 6 P-value=[1] 0.0004414905
## Iteration= 7 P-value=[1] 0.2786815
## Iteration= 8 P-value=[1] 0.04098317
## Iteration= 9 P-value=[1] 0.06366705
## Iteration= 10 P-value=[1] 0.08075527
## Iteration= 11 P-value=[1] 0.2499353
## Iteration= 12 P-value=[1] 0.000531078
## Iteration= 13 P-value=[1] 0.3113351
## Iteration= 14 P-value=[1] 0.2866835
## Iteration= 15 P-value=[1] 0.003862864
## Iteration= 16 P-value=[1] 0.03904427
## Iteration= 17 P-value=[1] 0.1078063
## Iteration= 18 P-value=[1] 0.3322702
## Iteration= 19 P-value=[1] 0.02115678
## Iteration= 20 P-value=[1] 0.003363011Again, from the 20 iterations above with a sample size of 5, I determined that several have a p-value of < 0.05 (which changes every time I run the for loop).
which(n_iterations < 0.05)## [1] 2 4 6 8 12 15 16 19 20Continuing to use this for loop, I have determined that the smallest sample size that is still statistically significant is 2, which is rather shocking. Evidence below!
n_iterations <- 1:20

for (i in n_iterations){
  plantpopulation1 <- rnorm(n=2, mean = 150, sd = 20)
  plantpopulation2 <- rnorm(n=2, mean = 200, sd = 50)
  Plant_Populations <- c(plantpopulation1, plantpopulation2)
  Group_Name <- c(rep("Plant_Population_1", length(plantpopulation1)),rep("Plant_Population_2",length(plantpopulation2)))
  plant_df <- data.frame(Plant_Populations, Group_Name)
  test_result <- t.test(Plant_Populations~Group_Name, data = plant_df)
  n_iterations[i] <- test_result$p.value
  cat("Iteration=",i,"P-value=")
print(test_result$p.value)
}
## Iteration= 1 P-value=[1] 0.0889894
## Iteration= 2 P-value=[1] 0.872714
## Iteration= 3 P-value=[1] 0.1386275
## Iteration= 4 P-value=[1] 0.7496838
## Iteration= 5 P-value=[1] 0.3180879
## Iteration= 6 P-value=[1] 0.3195668
## Iteration= 7 P-value=[1] 0.4214536
## Iteration= 8 P-value=[1] 0.08820295
## Iteration= 9 P-value=[1] 0.4635844
## Iteration= 10 P-value=[1] 0.5889882
## Iteration= 11 P-value=[1] 0.242081
## Iteration= 12 P-value=[1] 0.2048474
## Iteration= 13 P-value=[1] 0.9929695
## Iteration= 14 P-value=[1] 0.1756947
## Iteration= 15 P-value=[1] 0.1109476
## Iteration= 16 P-value=[1] 0.5940751
## Iteration= 17 P-value=[1] 0.3518635
## Iteration= 18 P-value=[1] 0.2606907
## Iteration= 19 P-value=[1] 0.3344272
## Iteration= 20 P-value=[1] 0.3398052which(n_iterations < 0.05)## integer(0)